We have done many posts in the past relating to ice-sheet modelling and its relationship to empirical or field data which stands up to scrutiny. The works of Henry Patton and others have been hugely influential in this field.
https://brian-mountainman.blogspot.com/2016/11/new-modelling-and-devensian-limit.html
Now there is another very important multi-authored paper by Christine Batchelor and others -- based on a huge amount of international cooperation. Here is the key info:
ARTICLE
https://doi.org/10.1038/s41467-019-11601-2
The configuration of Northern Hemisphere ice sheets through the Quaternary
Christine L. Batchelor et al,
Nature Communications, 2019
Our understanding of how global climatic changes are translated into ice-sheet fluctuations and sea-level change is currently limited by a lack of knowledge of the configuration of ice sheets prior to the Last Glacial Maximum (LGM). Here, we compile a synthesis of empirical data and numerical modelling results related to pre-LGM ice sheets to produce new hypotheses regarding their extent in the Northern Hemisphere (NH) at 17 time-slices that span the Quaternary. Our reconstructions illustrate pronounced ice-sheet asymmetry within the last glacial cycle and significant variations in ice-marginal positions between older glacial cycles. We find support for a significant reduction in the extent of the Laurentide Ice Sheet (LIS) during MIS 3, implying that global sea levels may have been 30–40 m higher than most previous estimates. Our ice-sheet reconstructions illustrate the current state-of-the-art knowledge of pre-LGM ice sheets and provide a conceptual framework to interpret NH landscape evolution.
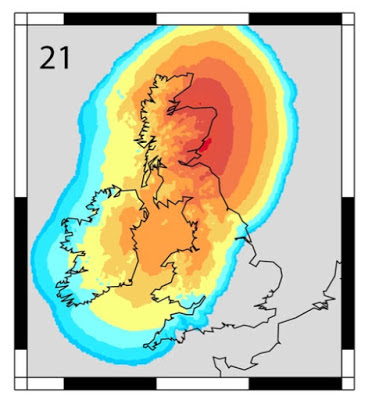
The paper looks at the evidence for ALL of the Northern Hemisphere glaciations, accepting that as we go back in time the day become more and more scanty. But there appear to have been TEN major glacial episodes over the past million years, and the "glacial intensity map" is a very interesting one, given that there is still a large amount of room for error when we focus in onto a large scale. Here is a blow-up of the bit we are interested in:
At the southernmost edge of the glaciated area there are large errors -- and the recent work in the Celtic Sea shows that on at least two occasions the ice edge was located far to the south, towards the bottom left corner in this image, on the edge of the continental shelf. But the most interesting feature of this reconstruction is the difference between the BIIS "core" area, where TEN glaciations may have been experienced, and the far south (including Pembrokeshire and the south of Ireland) where the landscape may have been affected by only three or four glacial episodes which covered approximately the same surface area.
This is an interesting map, showing the overlap between the extent of the MIS-6 glaciation (Wolstonian) and the LGM (Devensian). In the SW of the British Isles there was an almost 100% overlap, as sjown at the base of the map.
One other interesting piece of work in the paper is the attempt to recreate the biggest recent glaciation in the series of ten -- namely the MIS-6 glaciation. This is also the most mysterious glaciation, since evidence of it on the ground is very hard to find. Here is an enlargement of the relevant bit of the key map.
At the moment, we have no option but to assume that the MIS-6 and MIS-12 glaciations were of very similar extent and intensity.
With computer models of this type, rubbish in = rubbish out, and the line chosen for the feeding in of "empirical data" (the red line on the MIS-6 map) is more than a decade out of date, showing an absurdly improbable ice edge running across mid-Wales and another absurdly improbable line running southwards in the outer reaches of the Bristol Channel. Nonetheless, when the "best fit" line was generated by the computer, is showed ice pressing tight against the Atlantic cliffs of Devon and Cornwall, and even pressing in eastwards across the Somerset Levels and onto Salisbury Plain.
The MIS-12 glacial extent reconstruction. It is virtually identical to the MIS-6 reconstruction.
With computer models of this type, rubbish in = rubbish out, and the line chosen for the feeding in of "empirical data" (the red line on the MIS-6 map) is more than a decade out of date, showing an absurdly improbable ice edge running across mid-Wales and another absurdly improbable line running southwards in the outer reaches of the Bristol Channel. Nonetheless, when the "best fit" line was generated by the computer, is showed ice pressing tight against the Atlantic cliffs of Devon and Cornwall, and even pressing in eastwards across the Somerset Levels and onto Salisbury Plain.
Now where have we seen that before? Just a reminder of some of the "Anglian Glaciation" reconstructions........
We are talking about many different research teams here, involving a large number of independent scientists working cooperatively on a wide range of different projects. I take the the new research by Batchelor and her colleagues, and the older research by others, as a confirmation that it was not only possible but probable that glacier ice during the Anglian glaciation (and maybe the Wolstonian Glaciation too) reached Salisbury Plain. The laws of physics are rather important in determining how ice behaves. So this is still my best estimation of the extent of the ice-covered area around 450,000 years ago.

....... and we are still rather mystified as to what went on during the Wolstonian episode, around 140,000 years ago...........


No comments:
Post a Comment