
This is a topic to which we have returned many times, and will no doubt return again.......
I have been taking a fresh look at the highly influential paper by Patton et al (2016) which applies a more sophistcated modelling technique than ever before to the Eurasian ice sheet complex -- including the Celtic Ice Sheet (otherwise called the British / Irish Ice Sheet or BIIS). Although the work relates to the climatic and other conditions for the Late Weichselian (let's say 40,000 BP to 15,000 BP as being relevant to SW Britain) the modelling is in some respects more applicable to the earlier glaciations, since ground truthing suggests that the Celtic Ice Sheet never did develop to the full extent as predicted by the model.
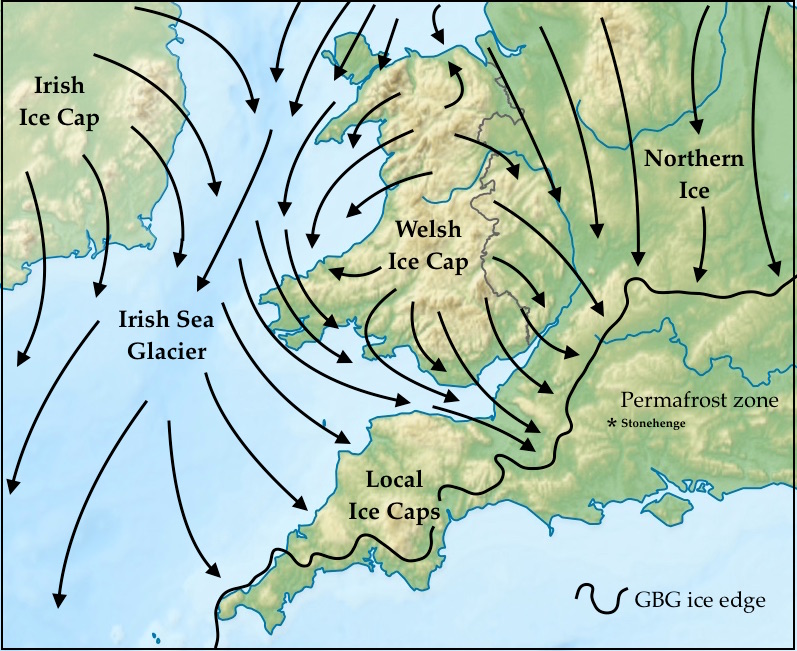
The map above shows the most commonly assumed Devensian ice limit (red line) for the British Isles, which is clearly inadequate in many respects. The area defined by the wavy dark blue line shows the maximum extent of the modelled ice sheet, based on an analysis of a vast range of different parameters. The orange areas are the areas of assumed highest erosion -- the dark blue area shows the ice shed location, stretching from the Lake District across to the Isle of Man and thence towards SW Ireland. Note that the ice is shown impinging well into the counties of Devon, Cornwall and Somerset, onto Salisbury Plain, and across the Midlands towards The Wash, incorporating a large area to the north of the Thames Basin assumed to have been unglaciated in the Devensian.
Take a look at these maps as well:


The similarity between these maps is remarkable, given that my map is based largely on ground evidence, and theirs is based on computer-based glacier modelling.
So far so good -- but the intriguing thing is that my map shows my assumed Anglian glacial scenario, and theirs shows a theoretical Late Weichselian scenario! I need advice from the experts. Watch this space........
-----------------------
Henry Patton, Alun Hubbard, Karin Andreassen, Monica Winsborrow, Arjen P. Stroeven. 2016.
The build-up, configuration, and dynamical sensitivity of the Eurasian ice-sheet complex to Late Weichselian climatic and oceanic forcing. Quaternary Science Reviews, Volume 153, 1 December 2016, Pages 97–121
http://dx.doi.org/10.1016/j.quascirev.2016.10.009
http://www.sciencedirect.com/science/article/pii/S0277379116304498
Note: Late Weichselian = Late Devensian
-----------------
Abstract
The
Eurasian ice-sheet complex (EISC) was the third largest ice mass during
the Last Glacial Maximum (LGM), after the Antarctic and North American
ice sheets. Despite its global significance, a comprehensive account of
its evolution from independent nucleation centres to its maximum extent
is conspicuously lacking. Here, a first-order, thermomechanical model,
robustly constrained by empirical evidence, is used to investigate the
dynamics of the EISC throughout its build-up to its maximum
configuration. The ice flow model is coupled to a reference climate and
applied at 10 km spatial resolution across a domain that includes the
three main spreading centres of the Celtic, Fennoscandian and Barents
Sea ice sheets. The model is forced with the NGRIP palaeo-isotope curve
from 37 ka BP onwards and model skill is assessed against collated
flowsets, marginal moraines, exposure ages and relative sea-level
history. The evolution of the EISC to its LGM configuration was complex
and asynchronous; the western, maritime margins of the Fennoscandian and
Celtic ice sheets responded rapidly and advanced across their
continental shelves by 29 ka BP, yet the maximum aerial extent
(5.48 × 10⁶ km2) and volume (7.18 × 10⁶ km3)
of the ice complex was attained some 6 ka later at c. 22.7 ka BP. This
maximum stand was short-lived as the North Sea and Atlantic margins were
already in retreat whilst eastern margins were still advancing up until
c. 20 ka BP. High rates of basal erosion are modelled beneath ice
streams and outlet glaciers draining the Celtic and Fennoscandian ice
sheets with extensive preservation elsewhere due to frozen subglacial
conditions, including much of the Barents and Kara seas. Here, and
elsewhere across the Norwegian shelf and North Sea, high pressure
subglacial conditions would have promoted localised gas hydrate
formation.
Out of curiosity, what are the factors leading to a larger spread of ice in the different ice ages?
ReplyDeleteDuration, intensity of cold, appropriate precipitation, solar variation?
Probably a huge range of answers. can the same be said about the median temperature in the various interglacials?
Dave
A huge range of parameters, Dave. Solar radiation, mean temperatures, annual temperature variations, wind directions, extent of permafrost, sea level position, sea temperatures, precipitation and distribution through the year, ocean current oscillations, topographic details, altitude of land surface, ice thickness and bed conditions, etc etc etc. Modelling is hugely complex, especially when they do it in 100 year (or shorter) slices....... in both the glacials and the interglacials there are oxygen isotope controls. Often these come from polar ice sheet cores -- especially from Greenland and the Antarctic.
ReplyDelete