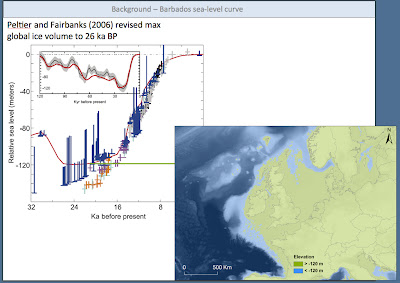
In the Powerpoint presentation by Patton et al (2011) there is an excellent illustration of the current consensus regarding the Devensian sea-level curve. In the illustration (based on the famous Barbados sea-level curve) we see that global sea-level reaches its low point of about -120m around 26,000 years BP, assumed to be the global glacial maximum. In the UK and Ireland, it looks as if the ice sheet reaches its greatest extent a bit later; not everything is in phase, and here and there we see lags of a thousand years or more.
The map on the right shows the "dry land area" at the time of the Devensian "sea level low point" -- in green. But remember that it will not have been quite this simple. Isostatic effects associated with ice buildup will have depressed parts of the crust in western Europe, and so parts of this green area might have been flooded. There were complex interactions between eustatic (sea level) and isostatic (loading and unloading) effects.
Brian
ReplyDeleteWhy are you trying to palm us off with out of date rubbish?
This 2006 map shows no sign of the Viking sandbank which is only 100m deep (according to my admiralty map) and covered in blue supposedly <120m.
The book 'Europes lost world - the discovery of Doggerland' shows a map on page 149 showing that at around 100-200m deep an area even further north called 'gulfaks' they found Mesolithic tools.
So either this map and chart is correct indicating these flints are now pre-Mesolithic and all our history based on these tools are wrong or that its a load of rubbish and this chart is unreliable.
Can you Geologists not read marine maps??
Annie O
A little more politeness, and a little less bluster, please, my dear Annie?
ReplyDeleteThe map shows no detail -- it is highly generalised and entirely fit for purpose.
Brian
ReplyDeleteYour sea rises have always been an interest to me.
This graph shows an increase of 140m in sea levels - as the earth is made up of 70% ocean and only 30% land that's a hell of lot of water.
Geologists seem to forget Archimedes' principle when taking these calculations into account (as I'm sure you are aware) that - "Any object, wholly or partially immersed in a fluid, is buoyed up by a force equal to the weight of the fluid displaced by the object"
Which means the ice cap melting on water will have minimal effect on sea levels!!
So if Antarctica melted (it has been calculated) that it would only raise the sea level by 61m - we are talking 140m.
Consequently, we are left with over TWICE as much ice than we have now on Antarctica today - So i'm with Annie on this one, what land masses in the Northern hemisphere was covered with this ice and does the area and depth match the water increase? - a part from that little sprinkle you keep putting on Presceli ?
RJL
Robert -- this is getting embarrassing. For a man who seems to pride himself on an understanding of sea-level change, your level of misapprehension is astounding. Eustatic mechanisms, Pleistocene ice volumes, and sea-level oscillations are well understood -- and the evidence from thousands of published and peer-reviewed papers is perfectly consistent. (There are minor variations, obviously, since isostatic - eustatic interactions vary from place to place.) For a nice simple introduction, I can thoroughly recommend my book called "The Ice Age" -- it's out of print long since, but you might find a cheap second-hand copy somewhere. Otherwise, look up glacio-eustasy on Google.
ReplyDeleteBy the way, Robert, the melting of sea ice and icebergs etc makes no difference to sea-level. The melting of land-based ice (in ice caps and ice sheets) does.
ReplyDeleteBrian
ReplyDeleteIf you don't know the answer then just say so - I will forgive you - your just a geologist.
"Eustatic mechanisms, Pleistocene ice volumes, and sea-level oscillations are well understood"
Great!! name the land masses and the height of the ice cap on those land masses - I'll do the maths for you to see how accurate you get it - is that information in your old book? If not - not much use really!!
RJL
Not sure what you are on about, Robert.
ReplyDeleteAre you disputing the eustatic curves established and verified over many years, from glaciated areas and from unglaciated areas? Or are you disputing the mechanisms involved in moving global sea-levels up and down by as much as 200m? Or are you just being generally cynical about anything and everything written by geologists and other earth scientists?
As for the Laurentide, Cordilleran,Scandinavian, West Siberian, East Siberian, Himalayan, Andean and British ice sheets, not to mention expanded Greenland and Antarctic sheets, are you now pretending that none of these actually existed in the Devensian? Are all of the thousands of researchers who have studied these ice sheets involved in a great anti-Langdon conspiracy?
Brian
ReplyDeleteI'm criticising the ACCURACY of these findings!!
The 'schoolboy maths' you are overlooking is that if 70% of the earth surface is water and 30% is land - then to raise the sea levels by 140m is equivalent to placing 326m of ice on THE ENTIRE land surface of the earth - not just a handful of countries.
Either more countries had ice on them or the thickness has been grossly underestimated.
This is scientific fact... not your simplistic guesstimations or sarcastic comments.
RJL
Huff and puff all you like, Robert -- but these are empirical findings, based upon many years of research in areas where the crust is stable. We left schoolboy maths behind many years ago in this field. Where on earth did you get that nonsense statistic from?
ReplyDeleteLet's get back to the top of the page and the area of dry land around our coasts - the result of the lowered sea level when lots of water was locked away from the sea in snow and ice.
ReplyDeleteRecent cores from Cumbria, not unconnected with the forthcoming nuclear waste disposal hole in the ground near Sellafield, show that sea levels near the Solway were ABOVE today's at the end of the Devensian. And an old Sellafield borehole showed salt water during the glacial. The weight of ice is not generally reckoned to be great enough to push the land down that much, but down it certainly was. Maybe the deformation of underlying rock has not been totally understood. Food for thought ...?
There was quite dramatic isostatic depression on the coasts of Cumbria -- this area was not far from the centre of UK glaciation. So when the sea flooded back in at the end of the Devensian, there was still a lot of uplift to be completed. There are some beautiful raised beaches on the coasts of Scotland and Donegal. Suggest you type in "isostasy" into the search box and get some more info. It all makes sense.
ReplyDeleteBrian
ReplyDeleteI was wondering if you could tell me what effect the Devensian had on people, animals and the environment in the long term. It seems that the Devensian is only explained and no one says what it actually meant for the Environment and the organisms that live in it.
Anna