
Inferred flowlines for the maximum glaciation phase of the Devensian Glaciation, representing a situation nof unconstrained flow within a substantial ice sheet. (Patton et al, 2017) Note that in this modelling, large erratics from mid-Wales could well have found their way to Salisbury Plain.
My reading of a recent article on Svalbard has reminded me that we know more about the last glacial cycle in that inhospitable and beautiful place than we do in Wales! We still do not know what the glacial "phases" were like, or how long they lasted -- let alone what their influence might have been on coastal landforms and sediments. In Svalbard there are glacial landforms and sediments (on land and on the sea bed) from three different "styles" of glaciation, related to (1) unconstrained ice flow by the overriding Barents Sea ice sheet, (2) a transitional type of flow in which ice streams and glaciers in the main fjords dominated, and (3) a local or highly constrained type of flow dominated by small glaciers in cirques and tributary valleys. The mapping of ice directions from these phases might seem complex, but it's all in reality perfectly sensible.
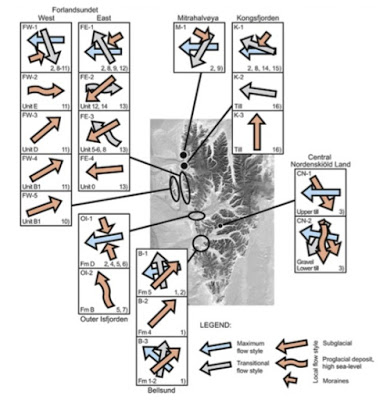
Ice flows from different phases of glaciation in the western part of Svalbard,
after Landvik et al, 2014.
We can assume that in every glacial cycle, there is an intensification of glacial activity (style 3 >>style 2>>style 1) and that at the end of the cycle, when climate ameliorates, glacial activity reduces (style 1>>style 2>>style 3). Of course, there may well be oscillations which will mess up this sequence of events, and non-climatic factors can also play a role in determining the course of events. And areas at the core of a glaciated region will experience a complete sequence of events while areas near the ice sheet edge will experience a partial or localised sequence of events which may be unique.
Back to Wales. A huge amount of work has of course been done over the past century or more, but we are still a long way from understanding how the ice coming from the Welsh Ice Cap interacted with ice from the dominating Irish Sea Glacier. During the 1900s there were abundant research projects designed to work out the sequence of events as represented in sediment sequences in particular, but in the present century there has been a move to modelling exercises and analyses of "lineations" seen in satellite images -- and for simplicity's sake most of the modelling has ignored the interactions between Welsh ice and Irish Sea ice. I have done abundant posts on all of this......
Glasser et al (2018) and others have modelled a Late Devensian ice cap with a maximum surface elevation of c 1200m:

However, on this map the white line in places shows the postulated ice cap limit in some places, and the postulated Irish Sea ice limit in others, and ignores abundant evidence of Devensian glacial activity aroun the SW, S and SE peripheries of Wales.
This map, published by the BGS, is more realistic in that it does show the flowlines for Irish Sea ice, but it does not make it clear which glaciation is which, and the implication is that the arrows for the Irish Sea Glacier in the Bristol Channel relate to an earlier glacial episode, and have nothing much to do with the Devensian. We now know that the glacier limit shown in West Wales is not at all accurate.

So are there many areas in which there were dramatic changes in ice flow directions, as in Svalbard? In North Wales the situation must at times have been chaotic, with north-flowing Welsh glaciers coming into direct conflict with the south-flowing Irish Sea Glacier. There must have been similar "glacier collisions" in NE Wales and perhaps in the southern parts of Cardigan Bay. I have speculated about this with regard to the confusing sediment sequence at New Quay.
In north Pembrokeshire the evidence of striations in coastal exposures of soft sedimentary rocks is difficult to interpret, but there do appear to have been quite wild swings in ice movement directions, and these must have been caused by shifts in the relative dominance of one ice mass or the other.

The dominant ice movement direction seems to have been from the NNW or NW, and this is confirmed by the maps of erratic transport.

And of course this gets even more interesting when we examine the evidence from South Wales and the Bristol Channel. This is the modified Kellaway map showing three parallel ice streams in the Bristol Channel. It has been heavily criticised by some, but it makes good glaciological sense, and if this was to be a map of part of the Svalbard coast, nobody would bat an eyelid.......
Anyway, we need much more work doing on all of this, and I look forward to seeing the models which predict just what went on in the "ice conflict zone', and when.

No comments:
Post a Comment
Please leave your message here