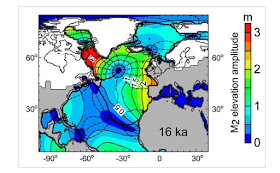
They are coming thick and fast. Another very interesting paper from James Scourse and colleagues, discussing the role of tides and relative sea-level in determining how the last Devensian ice sheet in the British Isles collapsed. The article is not easy to read -- its language is very convoluted -- but it suggests that there was a major difference in the style of deglaciation / ice sheet collapse in the western fringes of the British Isles as distinct from the Norwegian Sea / North sea sector because in the former there were "mega-tides" and in the latter there were much smaller tidal amplitudes. This is shown in this map, modelled for 16,000 years ago.
On the map we see tidal amplitudes of over 2m on the western fringes, but less than 1m in the north and east.
As we know, tidal range increases where there are topographic "funnel effects", as in the Bristol Channel of today, where in the inner reaches the tides have an amplitude of over 4m. The extreme tidal range is in the Severn Estuary, where it is around 50 ft or 15m. But at the peak of the last glaciation sea-level was around 120m lower than it is today, and so the coastal "palaeo-topography" was quite different. The coastline was out near the shelf edge, so while there may have been funnelling effects, they would have been in different places. But that's not the whole story, since glacio-isostasy has to come into the equation; as the ice sheet waxed and waned, so did its isostatic loading on the crust. That would have changed the alignment of the coastline, with the sea flooding into depressed areas -- except where grounded ice prevented it from doing so.
A hugely complex three-dimensional jigsaw puzzle. So good for James Scourse and other authors (in this paper and many others) for trying to sort it all out........
--------------------
J. D. Scourse, S. L. Ward, A. Wainwright, S. L. Bradley, and K. Uehara
Journal of Quaternary Science: Volume 33, Issue 2
February 2018, Pages 139-149
https://doi.org/10.1002/jqs.3011
https://onlinelibrary.wiley.com/doi/full/10.1002/jqs.301
ABSTRACT
Key external forcing factors have been proposed to explain the collapse of ice sheets, including atmospheric and ocean temperatures, subglacial topography, relative sea level and tidal amplitudes. For past ice sheets it has not hitherto been possible to separate relative sea level and tidal amplitudes from the other controls to analyse their influence on deglaciation style and rate. Here we isolate the relative sea level and tidal amplitude controls on key ice stream sectors of the last British–Irish and Fennoscandian ice sheets using published glacial isostatic adjustment models, combined with a new and previously published palaeotidal models for the NE Atlantic since the Last Glacial Maximum (22 ka BP). Relative sea level and tidal amplitude data are combined into a sea surface elevation index for each ice stream sector demonstrating that these controls were potentially important drivers of deglaciation in the western British Irish Ice Sheet ice stream sectors. In contrast, the Norwegian Channel Ice Stream was characterized by falling relative sea level and small tidal amplitudes during most of the deglaciation. As these simulations provide a basis for observational field testing we propose a means of identifying the significance of sea level and tidal amplitudes in ice sheet collapse.
Quote:
Increases in tidal amplitudes……… promote increased ice stream flow rates, promote iceberg calving and destabilize ice shelves, and the de‐buttressing that results from ice shelf collapse promotes ice stream acceleration. Tides are therefore integral to a series of positive feedbacks that promote ice sheet collapse with implications for global sea level.
Quote:
Several independent global palaeotidal model simulations are now available (Egbert et al., 2004; Uehara et al., 2006; Arbic et al., 2008; Griffiths and Peltier, 2009; Green, 2010) that indicate that the glacial North Atlantic, with ice‐equivalent sea levels 120–130 m lower than present (Peltier and Fairbanks, 2006), was characterized by megatidal amplitudes (amplitude > 5 m, tidal range > 10 m) and increased tidal dissipation rates (Griffiths and Peltier, 2009; Wilmes and Green, 2014).

No comments:
Post a Comment
Please leave your message here